Data Visualization for Business Strategy
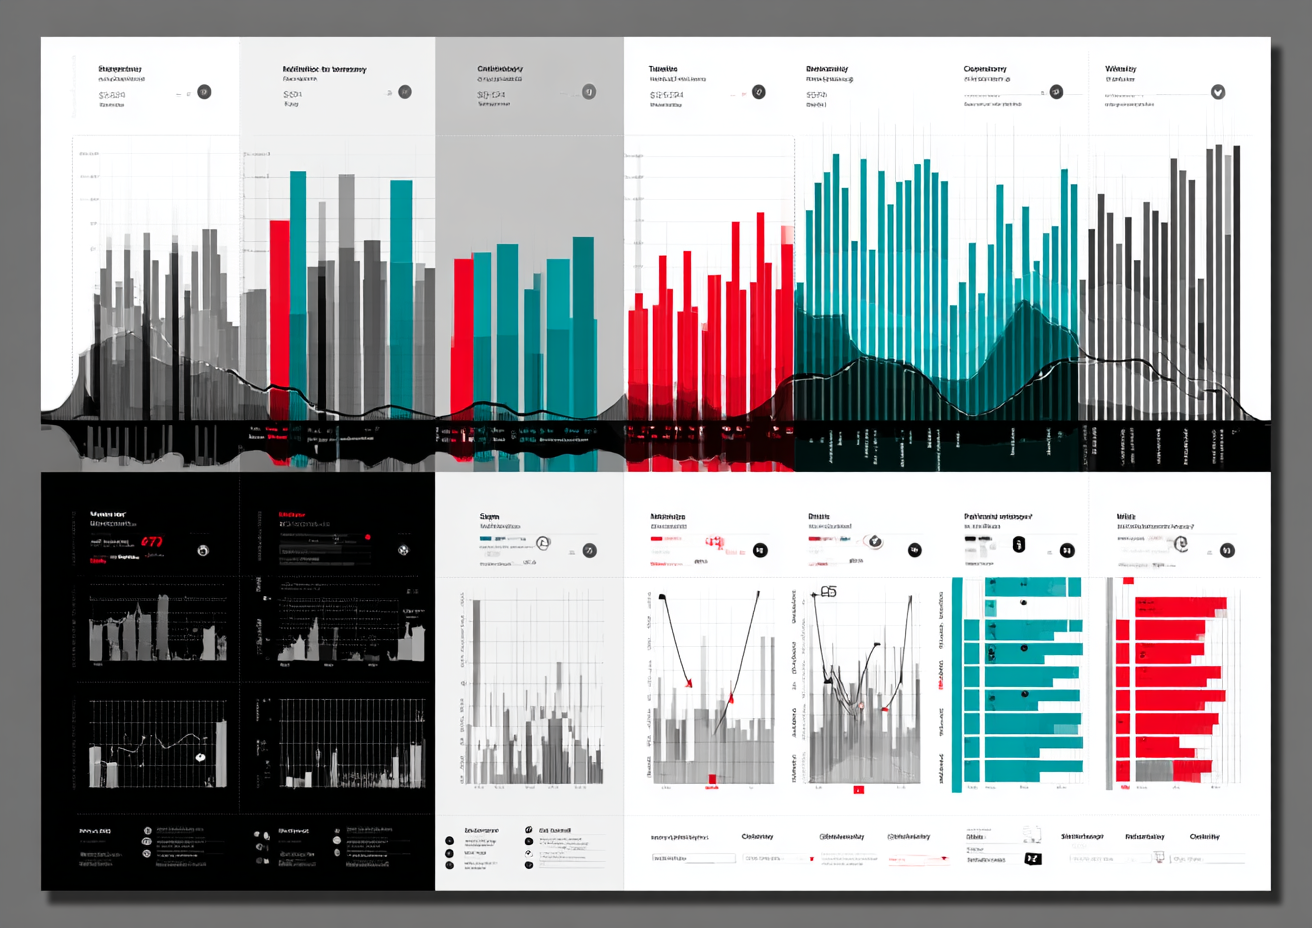
Aon helps organizations align Total Rewards strategies with business outcomes, focusing on talent retention, competitiveness, and peer benchmarking. I led the design of a multi-layered data visualization tool that translated highly complex HR and compensation data into clear, executive-ready insights.
Challenge
Retention risk and competitiveness are hard to measure without structured comparisons.
Executives needed visibility into compensation, benefits, job bands, and peer benchmarks.
Existing reporting methods were fragmented, static, and hard to act on.
As featured in Aon’s press release on Total Rewards strategies that drive business outcomes
Structure
My Role
Led information architecture and visualization strategy
Crafted a research plan for usability and product market fit testing
Unified 17+ data layers into one decision-making tool
Partnered with HR, finance, product, and engineering to align design with business outcomes
Team
Partnered with: SMEs, Product Management, Engineering, Business Development, Data Science, and Senior Designer
MVP Timeline
3 Months Design
3 Months Development
6 Months Total
Impact
Transformed static reports into a dynamic, executive-facing dashboard.
Improved clarity and decision-making around Total Rewards.
Aligned design with measurable business outcomes (retention, competitiveness, benchmarking).
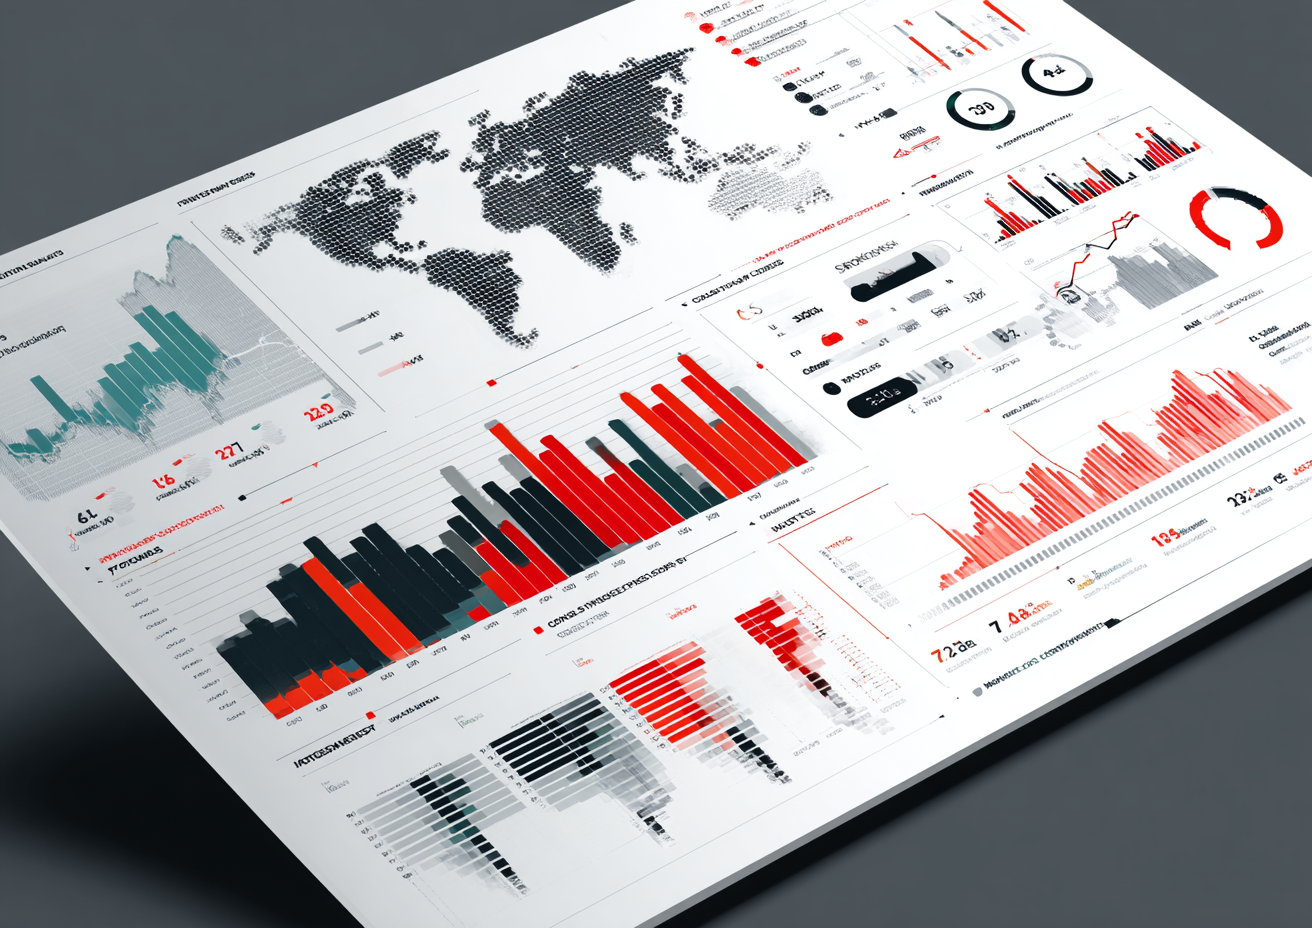
NDA Note
Due to confidentiality, full designs are not displayed publicly. The process, frameworks, and solutions can be shared privately upon request.